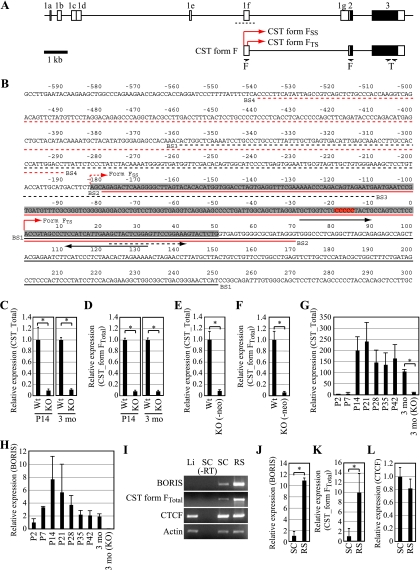
FIG. 4.
(A) Genomic structure of the CST gene. Open and filled boxes represent UTRs and open reading frames, respectively. It has been reported that CST has eight splicing variants, all of which have the same coding region with different 5′-UTR sequences (16). CST form FTS is the testis-specific form among splicing variants expressed in other tissues. Arrows denote the positions of primers used to evaluate the expression of CST form FTotal (F) and total CST (T). Red arrows indicate the transcription start site of CST form FSS and CST form FTS. A dotted line indicates sequences shown in panel B. (B) Sequences surrounding exon 1f. The gray box represents the reported exon 1f sequences. The numbering is relative to the transcription start site of CST form FTS, which is marked by a red arrow. The reported transcription start site is marked by a dotted red arrow. The red box shows BORIS/CTCF-contacting residues as determined in a methylation interference assay. Black arrows indicate primers for CST form FSS. The dotted black arrow indicates a forward primer for CST form FTotal. DNA fragments used for EMSA are denoted by solid lines or dotted lines in black or red. (C) cDNAs prepared from wild-type or BORIS−/− mouse testis at P14 (n = 3) or at 3 months (n = 3) were subjected to qPCR to evaluate the expression of CST form F. Primers for total CST were used for the experiment. Expression levels are shown as the ratio to wild-type level. Asterisks denote statistical significance (P < 0.005). (D) cDNAs prepared from wild-type or BORIS−/− mouse testes at P14 (n = 3) or at 3 months (n = 3) of age were subjected to qPCR to evaluate the expression of CST form F. Primers for CST form FTotal were used for the experiment. Expression levels are shown as the ratio to the wild-type level. Asterisks denote statistical significance (P < 0.005). (E) cDNAs prepared from wild-type or BORIS−/− (-neo) mouse testis at P28 were subjected to qPCR to evaluate the expression of CST (n = 3). Primers for total CST were used for the experiment. Expression levels are shown as the ratio to wild type. The asterisk denotes statistical significance (P < 0.005). (F) cDNAs prepared from wild-type or BORIS−/− (-neo) mouse testis at P28 were subjected to qPCR to evaluate the expression of CST (n = 3). Primers for CST form FTotal were used for the experiment. Expression levels are shown as the ratio to wild type. The asterisk denotes statistical significance (P < 0.005). (G) cDNAs prepared from wild-type testes were subjected to qPCR analysis to evaluate the expression of CST during testis development. Primers for total CST were used for the experiment (n = 3). Expression levels are shown as the ratio to the P2 testis level. The asterisk denotes statistical significance (P < 0.005). (H) cDNAs prepared from wild-type testes were subjected to qPCR analysis to evaluate the expression of BORIS during testis development (n = 3). Expression levels are shown as the ratio to the P2 testis level. (I) Expression levels of BORIS, CST, and CTCF were analyzed by RT-PCR. cDNAs were prepared from liver (Li), spermatocytes (SC), and round spermatids (RS). (J to L) cDNAs prepared from SC and RS were subjected to qPCR analysis to evaluate the expression levels of BORIS (J), CST (K), and CTCF (L) (n = 3). Expression levels are shown as the ratio to the level in spermatocytes. Asterisks denote statistical significance (P < 0.05).

