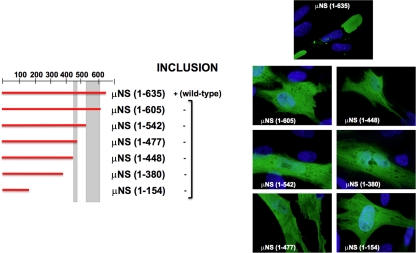
FIG. 3.
Summary of the expression of C-terminal truncations of μNS. Full-length μNS is schematically indicated by a horizontal red bar comprising residues 1 to 635 (the positions are numbered on the top and right). A similar red bar indicates each single truncation, spanning the approximate region corresponding to the construct. The positions of two previously described coiled-coil elements predicted in the sequence of μNS are indicated by two vertical gray bars. The ability of each construct to form intracellular inclusions is indicated as positive (+) or negative (−), and representative immunofluorescence images of transfected CEFs are presented on the right. The immunofluorescence analysis was performed as indicated in Fig. 2b on CEFs fixed after 18 h of transfection with plasmids expressing the indicated C-terminal μNS truncations.

