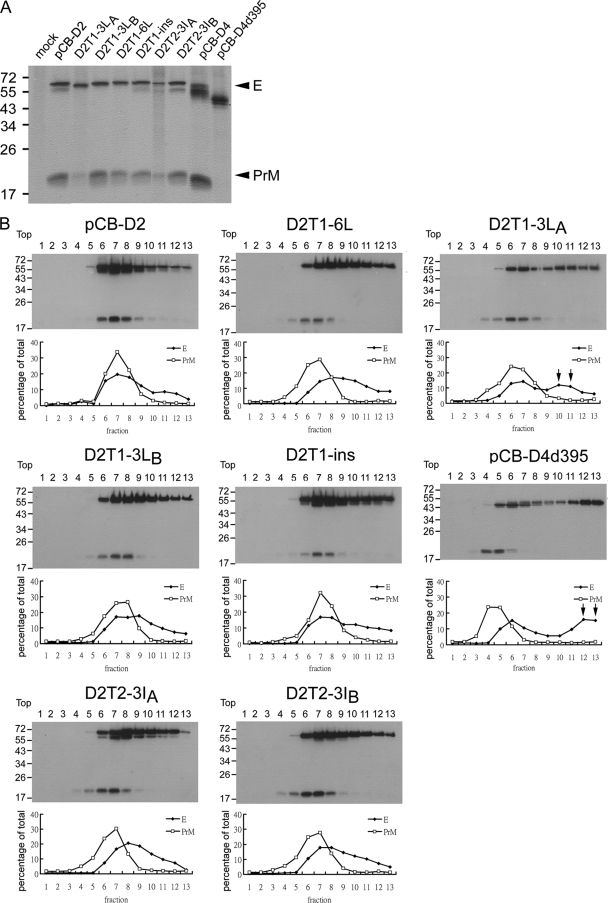
FIG. 6.
Interaction between PrM and E proteins. (A) Radioimmunoprecipitation assay. 293T cells transfected with the PrM/E expression constructs were labeled with [35S]methionine at 20 h posttransfection, immunoprecipitated with anti-E MAb FL0232, and subjected to 12% PAGE as described in Materials and Methods. Arrowheads indicate E and PrM proteins. (B) Sucrose gradient sedimentation analysis. Cell lysates derived from 293T cells transfected with PrM/E expression constructs were subjected to 5 to 20% (wt/wt) sucrose gradient ultracentrifugation, and each of the 13 fractions was collected and subjected to Western blot analysis using serum from a confirmed DENV2 case (70). Molecular mass markers are shown in kDa. The intensities of the E and PrM bands in each fraction were determined and are presented as the percentage of total intensities of E and PrM bands, respectively, below each lane. Arrows indicate the shift of the peak of E protein in some mutants.

