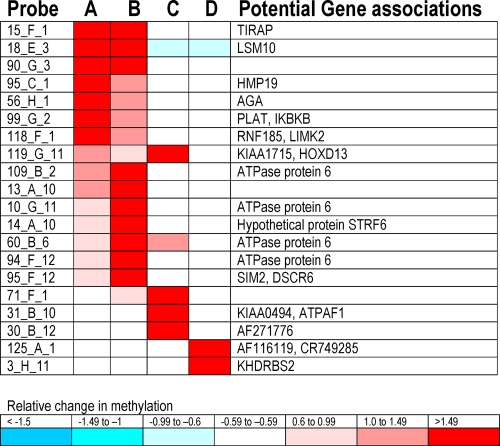
FIG. 5.
Heat map of the CpG islands with normalized fluorescence ratios of ≥1.5. The name of the probe on the chip is shown in the first column. Each probe identifies a specific area of the human genome that contains a CpG island that can be methylated. Each CpG island can have a specific linkage to potential genes, and these genes are shown in the last column. Column A shows the results for the experimental conditions of the HBV infection model compared to those of day 0 cells (row 1 in Fig. 4A); column B corresponds to the experimental conditions of the HBV infection model compared to those of day 15 cells (row 2 in Fig. 4A); column C corresponds to the experimental conditions of the HBV transfection model compared to those of untransfected cells (row 1 in Fig. 4B); column D corresponds to the experimental conditions of the HBV infection model compared to those of cells exposed to full-length but fragmented HBV (row 3 in Fig. 4A).

