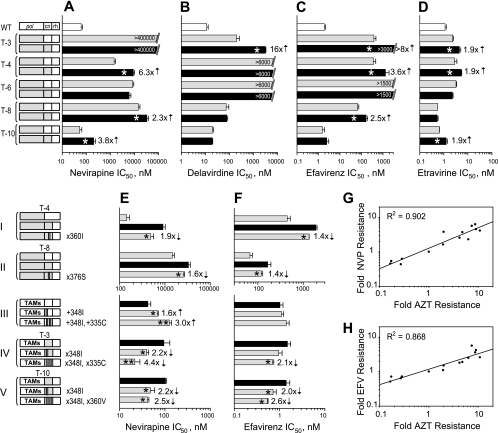
FIG. 2.
Effect of CN mutations from treatment-experienced patients' RTs on NNRTI resistance. (A to D) IC50 determinations for the viruses containing CN mutations from treatment-experienced patients' RTs in the context of their own pol to NVP (A), DLV (B), EFV (C), ETR (D). White bars represent the average IC50 for the wild-type RT control; gray bars represent RTs containing pol domains originated from the patients' virus; black bars represent both pol and CN originated from the patients' virus. Numbers in front of black bars represent fold changes, and asterisks within the black bars indicate a statistically significant difference in IC50 within each pair of RTs connected by a bracket (t test, P < 0.05). Numbers within bars represent the maximum drug concentration used for the testing that was not sufficient to inhibit viral replication. (E and F) IC50 determinations for the viruses containing specific CN mutation(s) from treatment-experienced patients' RTs to NVP (E) and EFV (F). Numbers in front of gray bars represent fold changes, and asterisks within the gray bars indicate a statistically significant difference in IC50 versus the black bar for each group connected by a bracket (t test, P < 0.05). Direction of arrow located near the number indicates a decrease or increase in resistance caused by mutation. An additional asterisk within the bar indicates a statistically significant change in resistance for the double mutant versus the single mutant within the group (t test, P < 0.05). Schematics of the corresponding RT structures are depicted on the left-hand side of panels A, B, C, D (top part), and E and F (bottom part). Groups of constructs are connected by a bracket. White boxes in schematics represent the wild-type sequences, and gray boxes represent the patients' RT sequences; white strips within the gray box indicate the reversion of the mutant amino acid to the wild type; gray strips within the white box indicate a replacement of the wild-type amino acid to the mutant amino acid. Specific mutations are shown near each construct where applicable, designating either the reversion of this mutation to the wild-type amino acid (e.g., ×360I) or the reversion of the wild-type amino-acid to the mutant amino acid (e.g., +348I). Linear regression analysis of resistance changes to AZT versus NVP (G), and to AZT versus EFV (H) caused by CN mutations from treatment-experienced patients. Resistance data for NVP and EFV are collected from Fig. 1A and panels A, C, E, and F of this figure and, for AZT, from reports by Delviks-Frankenberry et al. (12) and Nikolenko et al. (34). The correlation coefficients (R) were determined using SigmaPlot 8.0 software. Fold resistance was calculated as a ratio between IC50s for virus containing specific mutation(s) and correspondent control virus without this mutation(s).

