FIG. 1.
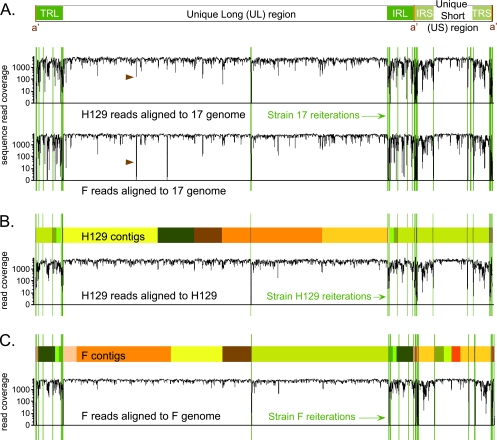
Overview of genome coverage for HSV-1 strains F and H129, relative to strain 17 or to their own newly assembled genomes. (A) Diagram of the HSV-1 genome structure, with two unique regions (long and short), each flanked by a pair of terminal repeats. The line graph depicts the depth of sequence read coverage for the newly sequenced strains when each one is aligned to the reference, strain 17. The VNTRs, or reiterations, of strain 17 are overlaid as green lines onto the coverage graphs. Reductions in coverage correlate with the reiterated sequences and also occur more frequently in the terminal repeats that flank each unique region. Brown arrowheads highlight a dip in both new genomes when aligned against strain 17; this is the location of an insertional frameshift in the UL17 gene of strain 17 that leads to alignment mismatch in the nonframeshifted strains F and H129. (B and C) Colored boxes depict the blocks of continuous sequence, or contigs, assembled for each strain. Boxes of the same color represent the same contig; these appear twice when they include sequence in the repeat regions. Sites of reiterations (VNTRs) are overlaid in green. In some cases contigs assembled through a reiteration; in others the contigs terminated at the reiterations. The line graph below the contigs for each strain depicts the improvement in depth of sequence read coverage when data from strain H129 were aligned to the newly assembled H129 genome (B). A similar graph is depicted for strain F (C). Sharp drops in alignment coverage remain at the VNTR sequences inserted from strain 17.

