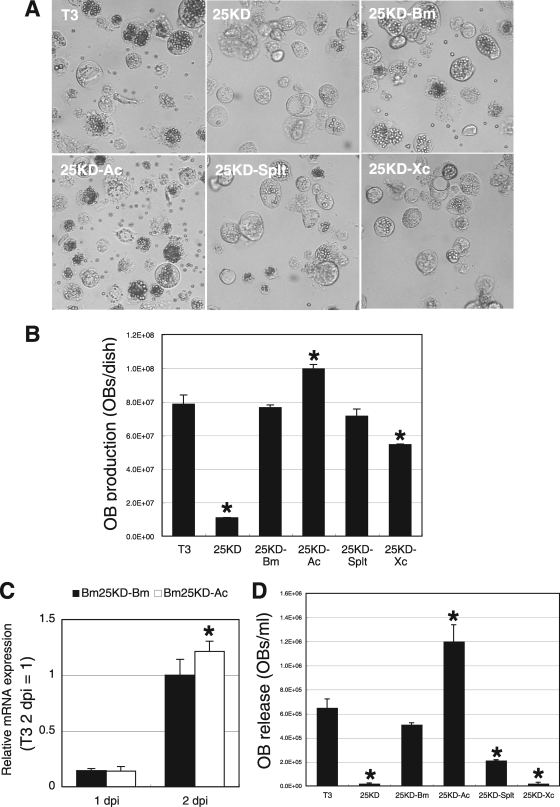
FIG. 2.
Comparison of OB production levels in BmN cells. (A) Light microscopic observations of BmNPV-infected BmN cells at 5 dpi. (B) OB production. BmNPV-infected BmN cells at 3 dpi were gently scraped using a rubber policeman, and total OB production was measured. Data shown are means ± standard deviations (SD; n = 3). *, P < 0.05 by one-way ANOVA and Dunnett's posttests using T3 as a control. (C) polh expression in Bm25KD-Bm- and Bm25KD-Ac-infected BmN cells. BmN cells were infected with Bm25KD-Bm and Bm25KD-Ac at an MOI of 5. Total RNA was reverse transcribed, and qRT-PCR analysis of polh was performed. Data shown are means ± SD (n = 3). *, P < 0.05 by Student's t test. (D) OB release from BmNPV-infected BmN cells at 5 dpi. Data shown are means ± SD (n = 3). *, P < 0.05 by one-way ANOVA and Dunnett's posttests using T3 as a control.

