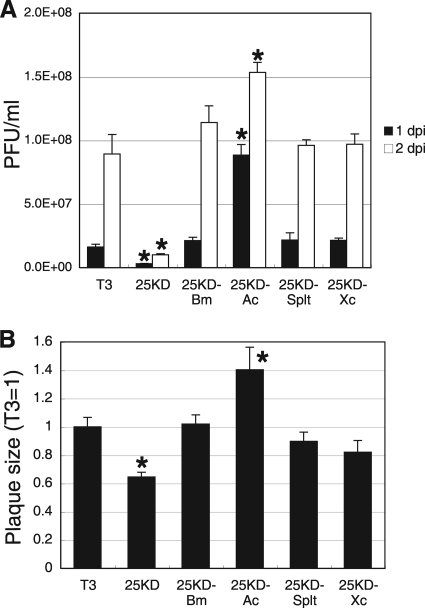
FIG. 3.
Comparison of BV production levels and plaque sizes in BmN cells. (A) BV production. BmN cells were infected with T3 or recombinant BmNPVs at an MOI of 5. BV titers at 1 and 2 dpi were determined by plaque assays. Data shown are means ± SD (n = 3). *, P < 0.05 by one-way ANOVA and Dunnett's posttests using T3 as a control. (B) Plaque size. Plaques were photographed, and their sizes were quantified using ImageJ software. Data shown are means ± SD (n = 10). *, P < 0.05 by one-way ANOVA and Dunnett's posttests using T3 as a control.

