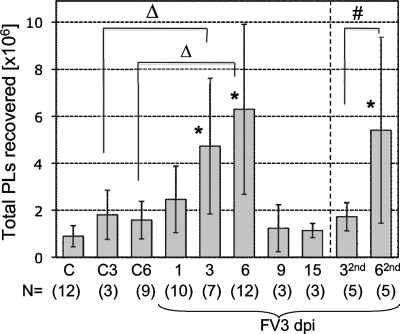
FIG. 1.
Total numbers of PLs recovered by lavage during primary and secondary FV3 infection. Averages ± standard deviations from 3 to 4 independent experiments of PLs collected in a volume of approximately 4 to 5 ml of APBS from 2- to 3-in. naïve frogs infected with 1 × 10⁶ to 5 × 10⁶ PFU of FV3 once for 1 to 15 days or at 1 month prior to the experiment and reinfected for 3 (32nd) and 6 days (62nd). Control animals were injected with saline vehicle for 3 (C3) or 6 (C6) days or uninjected (C). Statistical significance was determined by ANOVA (*, P < 0.01 relative to C; #, P < 0.01 between 32nd and 62nd; Δ, P < 0.05 between C3 and 3; see Materials and Methods for more information) for experimental groups containing more than five animals. Numbers of animals for each group are indicated at the bottom of the graph (N).

