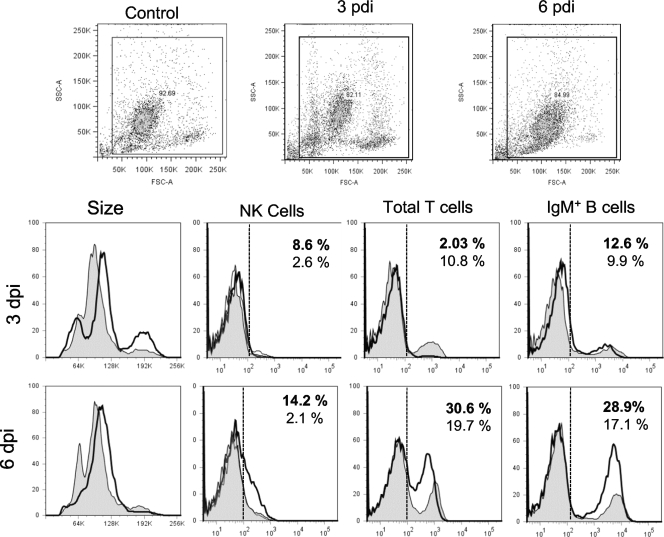
FIG. 5.
Lymphocytes and NK cells in PLs of FV3-infected animals. Representative single-color flow cytometry analysis of PLs isolated from uninfected and infected (1 × 10⁶ PFU of FV3) animals at days 1, 3, and 6 postinfection and stained with MAbs specific to Xenopus NK cells (1F8), total CD5 T cells, and IgM+ B cells are shown. Forward and side scatter dot plots (10,000 events collected) with the gates used for the histograms are shown. The percentages of positive cells compared to the isotype control for uninfected (regular fonts) and infected (bold fonts) frogs are indicated. Filled peak, uninfected PLs; solid thick peak, infected PLs; dashed line, limit of signal intensity for 95% of PLs stained with isotype Ab control.

