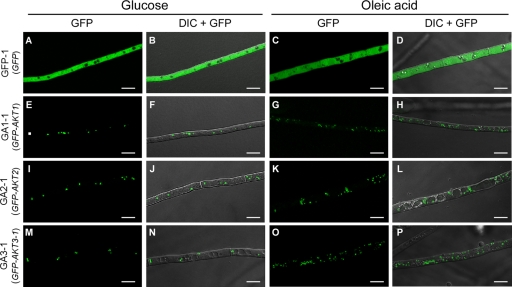
Fig. 2.
Intracellular localization of GFP-tagged Akt1, Akt2, and Akt3-1. Strains were grown for 3 days on potato agar medium supplemented with glucose or oleic acid. GFP-1, pYTGFPc transformant (A to D); GA1-1, pGFP-AKT1 transformant (E to H); GA2-1, pGFP-AKT2 transformant (I to L); GA3-1, pGFP-AKT3 transformant (M to P); GFP, GFP fluorescence images; DIC + GFP, DIC images merged with GFP fluorescence images. Bars = 10 μm.

