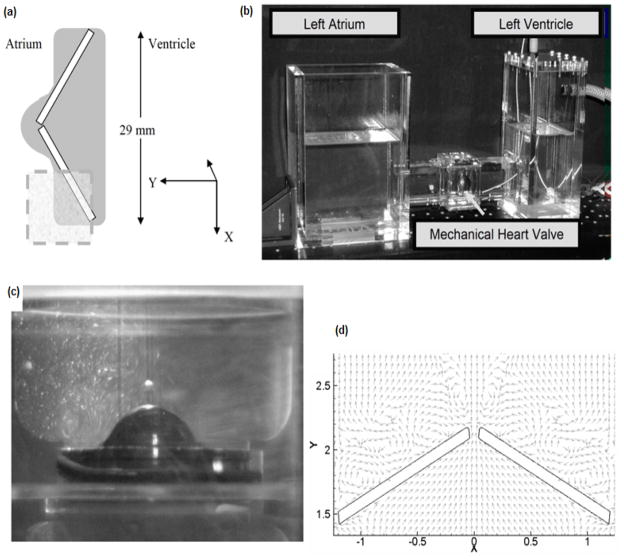
Figure 2.
(a) Schematic of experimental set-up. The rectangle marked out in the figure indicates the regions where the LDV measurements are made. (b) Photograph of experimental set-up. (c) Flow visualization with a light sheet illuminating the centerline of the valve indicating the recirculation regions near the leaflets during the valve closing phase. (d) Numerical simulation results show qualitatively similar re-circulation regions.

