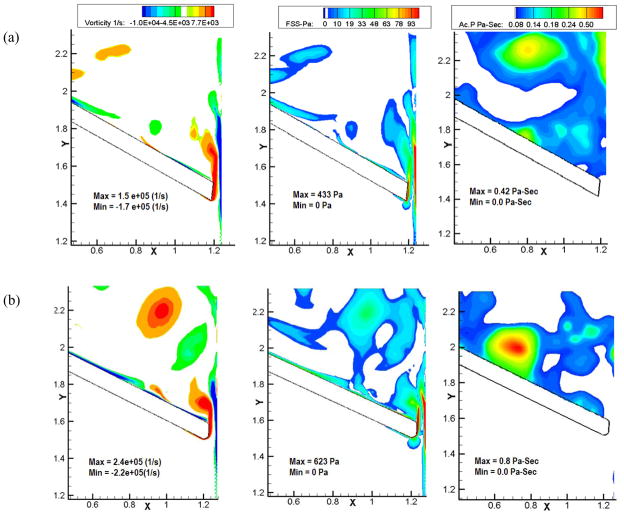
Figure 8.
Plots of vorticity contours (Column 1), shear stress (Column 2), and the platelet activation parameter (Column 3) of (a) Valve-1 and (b) Valve-2 at 18 ms after the instant of valve closure. In the activation parameter plots, regions with bright red indicates higher potential for platelets to be activated and dark blue represents minimal potential for the same. Larger regions of bright red for Valve-2 indicate higher potential for platelet activation compared to that for Valve-1 during the initial impact and rebound phases of valve closure.

