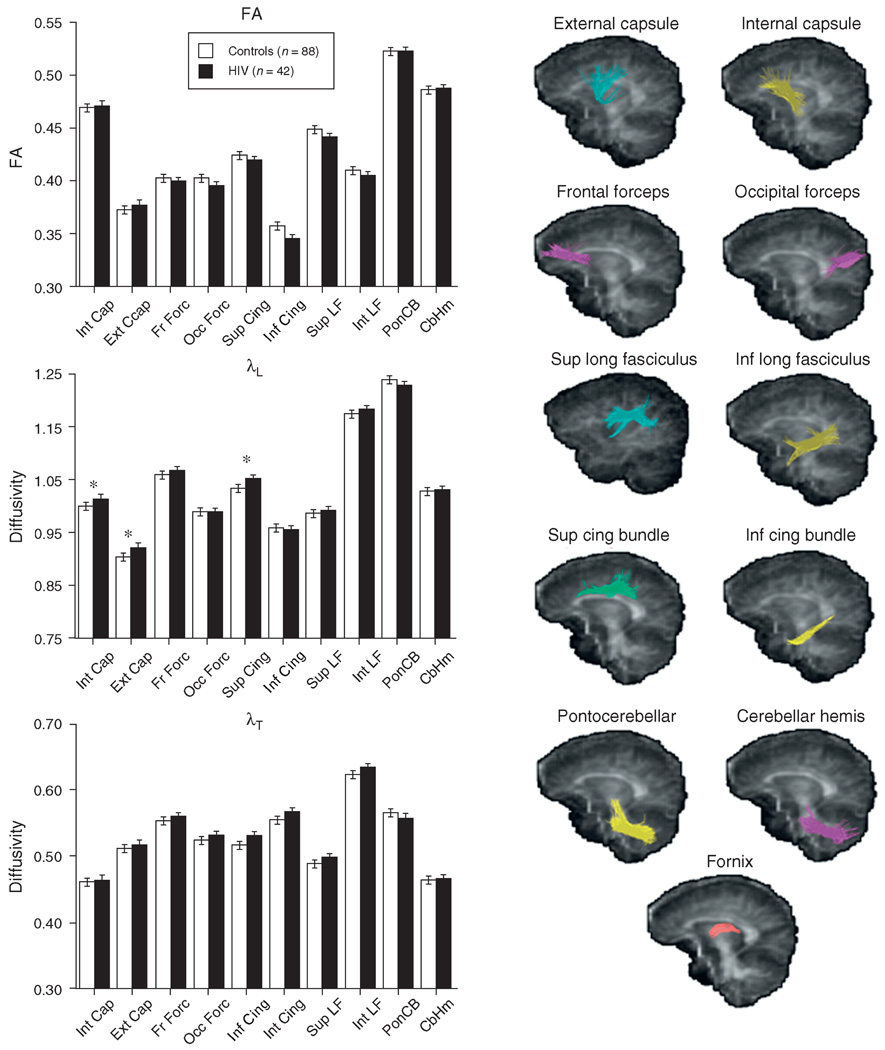
Fig. 2. Mean±SE fractional anisotropy, λL, and λT for each of the 10 bilateral projection and association fiber bundles of the control and HIV groups.
The sagittal images provide examples of the location of each bundle tracked. Values of the fornix were not plotted because its diffusivity values were about twice that of the other tracts. *P<0.05.

