
Figure 3. DSIF and NELF co-occupy most genes with Pol II.
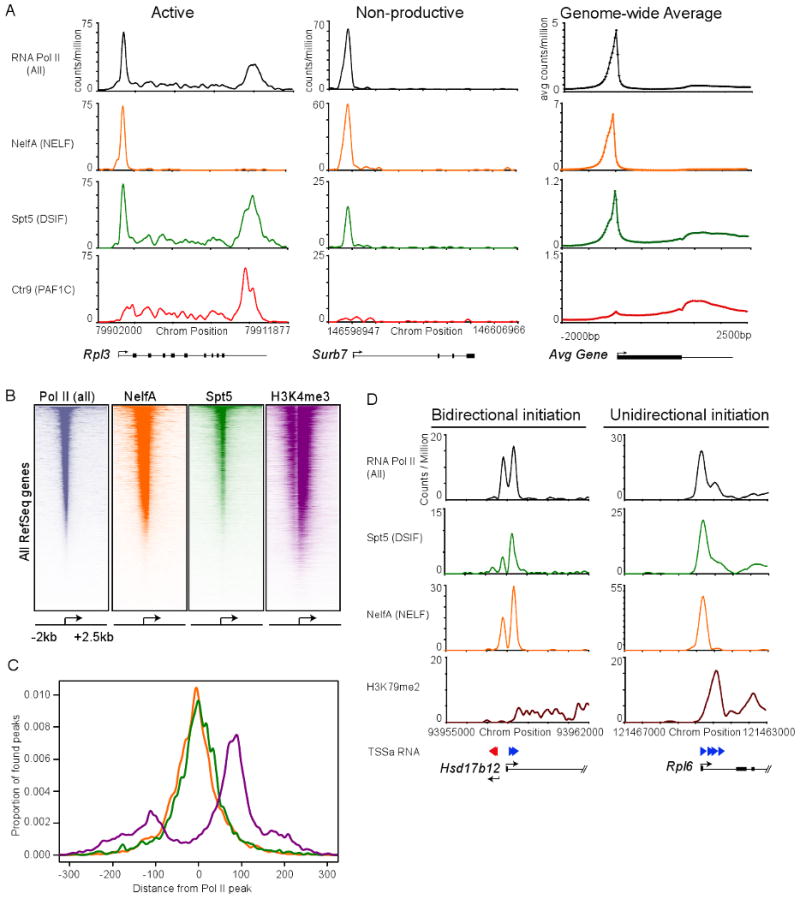
(A) Binding of Pol II (all), NelfA (NELF subunit), Spt5 (DSIF subunit) and Ctr9 (PAF1 subunit) using ChIP-seq analysis at a representative active gene (Rpl3), and non-productive gene (Surb7) in mES cells. Genome-wide binding averages (introns not depicted), in 50bp bins, are shown for each factor to display the general binding patterns along the transcription unit of RefSeq genes, from 2kb upstream of the transcriptional start site to 2.5kb downstream of the end of each annotated gene.
(B) Heatmap representation of ChIP-seq binding for Pol II (all; grey), NelfA (orange), Spt5 (green) and H3K4me3 (purple) at all mouse RefSeq genes, rank ordered from most Pol II to lowest Pol II. Color means enrichment, white means no enrichment. See also Figure S3.
(C) Spatial distribution of the distance of Spt5, NelfA and H3K4me3 peaks from the promoter proximal Pol II peak at each enriched Pol II gene, demonstrating a general overlaps with Spt5, NelfA and Pol II peaks.
(D) ChIP-seq binding plots showing Pol II (all), Spt5 (DSIF), NelfA (NELF), elongation-associated chromatin modification (H3K79me2) and TSSa-RNA reads that map to this genomic region at a bidirectional intiated gene (Hsd17b12) and unidirectional initiated gene (Rpl6). Red arrows represent TSSa-RNA species that map in the antisense direction to the gene, and blue arrows represent TSSa-RNA species that map in the sense direction to the gene.