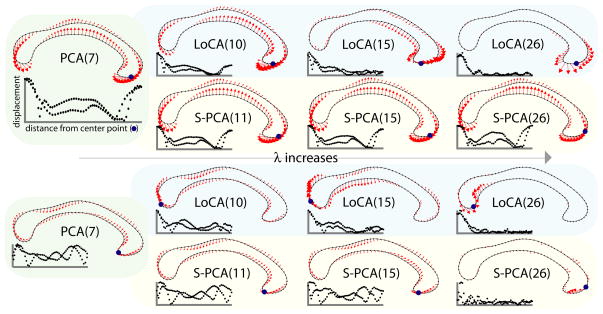
Fig. 2.
Effect of λ on the first (top) and third (bottom) basis vectors, where vectors are ordered by the amount of shape variation captured. As λ increases, the number of vectors required to capture 90% of the variation (in parentheses) increases. For small values of λ, vectors capturing substantial variation represent a global deformation of the entire shape. As λ is increased, more of the LoCA vectors become local deformations, until the entire basis consists of local vectors. S-PCA becomes sparse more slowly, so that the first vector is still a global deformation on the right. The third vector is sparse, but there is some perturbation across the entire shape. Each vector is accompanied by a graph showing its locality, where every point in the graph represents a point on the outline. The center point is defined as the point minimizing Eloc, as described in Section 3.

