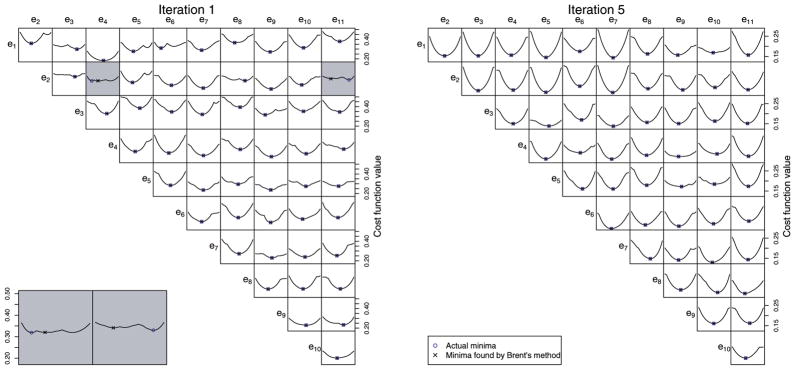
Fig. 2.
For each possible pairing of basis vectors among the 10 that account for the highest amounts of shape variation in the ventricle data set, a graph is shown that represents the value of the cost function for all possible angles of rotation of the basis pair in the plane they span. The minimum-cost rotation angle and the rotation angle found by Brent’s method are shown; in almost all cases, these are identical. When they are not (see lower left), it is typically due to a flat cost function where many rotation angles provide nearly the same reduction in cost. These graphs are representative of the graphs for the other data sets.

