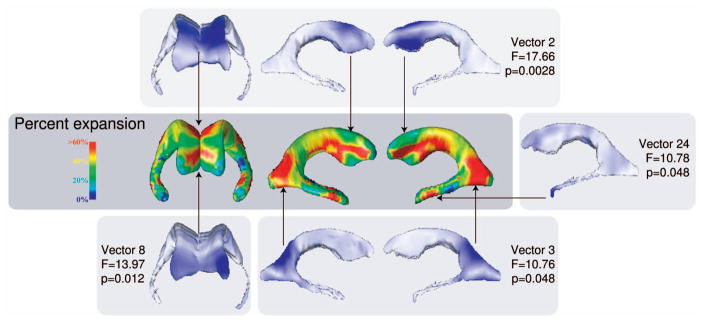
Fig. 4.
Differences between AIDS and control groups in ventricular shape as characterized by LoCA and a complementary radial thickness mapping approach. Regions that are extremely dilated in the AIDS group relative to controls are shown in red in the spatial map; LoCA shape components whose coefficients differed significantly between AIDS and control groups are also shown to illustrate the agreement between the methods. The portion of the ventricular surface accounted for by each LoCA shape component is shown in blue. Shown p-values have been Bonferroni-corrected to correct for multiple comparisons. The spatial map was adapted from a similar figure in [16].

