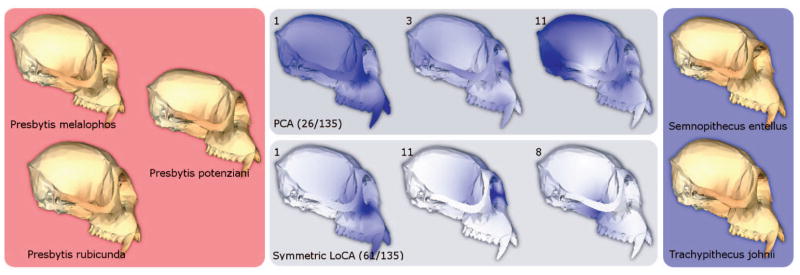
Fig. 6.
t-Tests were used to assess differences in PCA and LoCA shape component coefficients between monkey crania drawn from differing branches in an evolutionary tree. Sample crania from the two branches are shown on the left and right. The three PCA vectors and three LoCA vectors with the lowest t-test p-values are depicted visually; the regions of the cranium affected by each vector are shown in dark blue. Each PCA vector represents a complex spatial pattern of shape characteristics, while each LoCA vector focuses on a single localized skull region.

