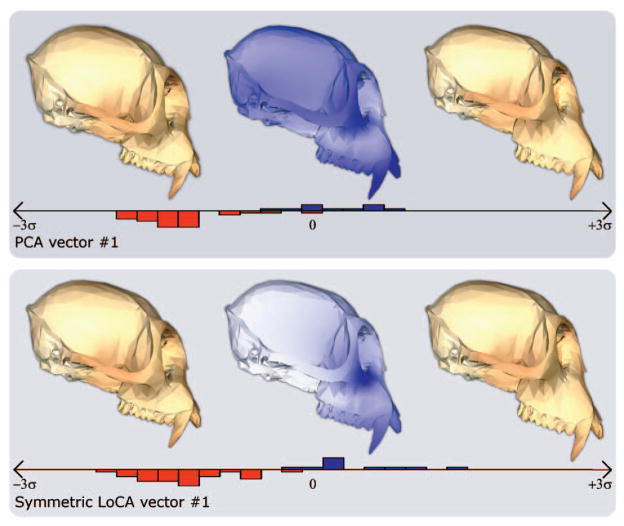
Fig. 7.
The PCA and LoCA vectors with the lowest p-values from Fig. 6 are depicted in more detail: for both basis vectors, crania corresponding to the mean shape component coefficient value over both groups, plus or minus two standard deviations, are shown. Also shown are histograms that give the distributions of coefficient values for the group shown on the left in Fig. 6 (red) and the group shown on the right (blue).

