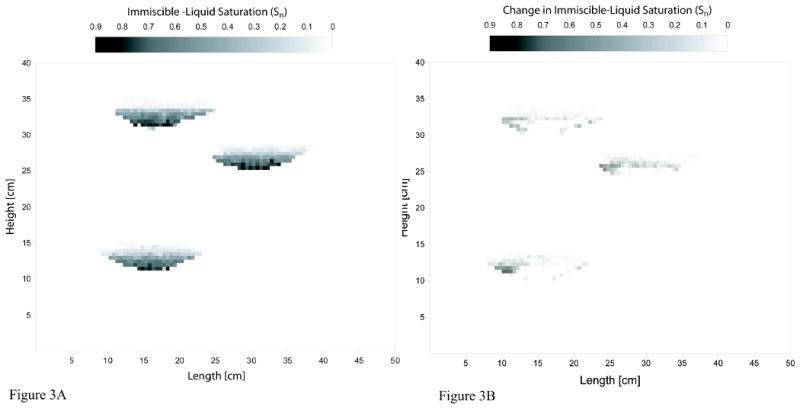
Figure 3.

Figure 3A. Schematic of source-zone configuration for the Pool experiment. Also shown is the initial immiscible-liquid saturation distribution measured with the dual-energy gamma system.
Figure 3B. Immiscible-liquid saturation removed after approximately 63 pore volumes of water flushing (low values correspond to minimal removal and vice versa).
