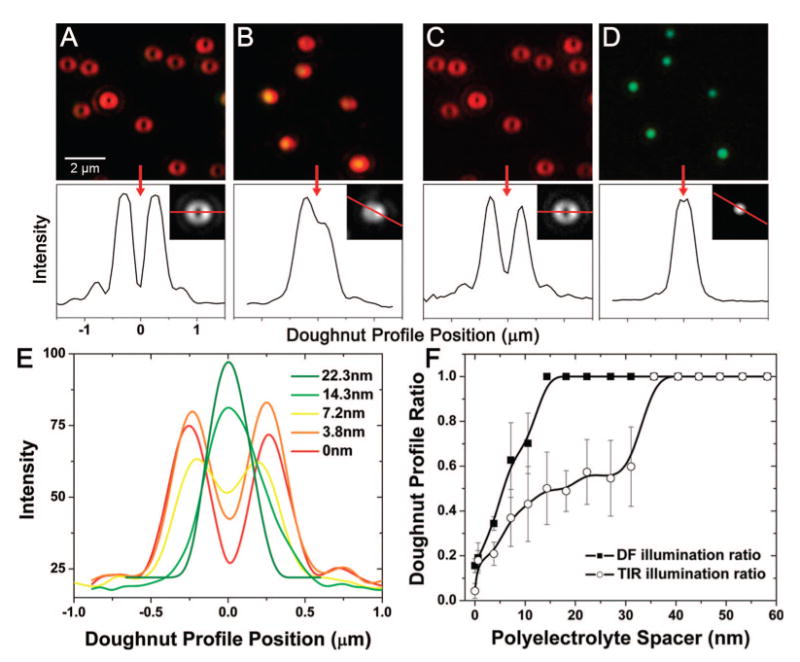
Figure 4.

Microscope images (color and grayscale CCD) of scattering from 60 nm gold nanoparticles (NPs) on a 45 nm thick gold film. Line plots through the grayscale CCD images demonstrate the far-field image pattern resulting from polarized dipole radiation. (A) NPs spaced 0 nm from the gold film, excited with TIR white light. (B) NPs spaced 22.3 nm from the gold film by a PE layer and excited with TIR white light. (C) NPs spaced 0 nm from gold film and excited with dark-field white light. (D) NPs spaced 22.3 nm from gold film, excited with dark-field white light. Note: the same NPs are shown in (A) and (C) and in (B) and (D). The doughnut-shaped profile can be used as a metric to track the distance of the NP from the surface of the gold film. (E) Image line plot through single gold NP scatterers at incrementally increasing distances above the gold film. (F) Accumulated analysis of many NP scatterers (10 at each PE layer, standard deviation error bars included), plotting the ratio of the central minimum intensity to the maximum intensity of the PSF as a function of the distance above the surface of the gold film.
