
Figure 6.
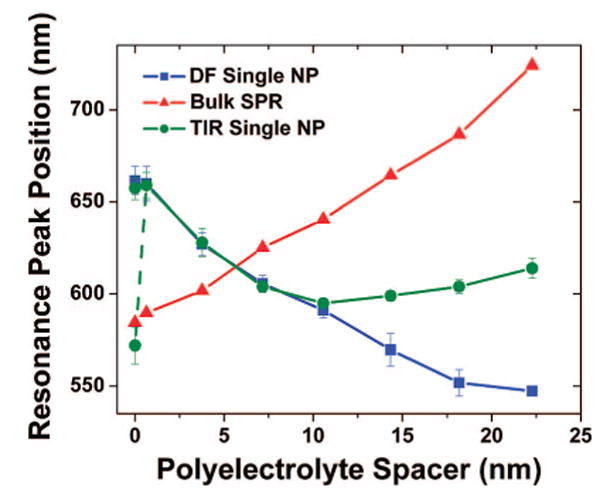
Peak positions of the measured plasmon resonances as a function of the polyelectrolyte (PE) spacer thickness. The SPR extinction (red triangles) is collected from the gold film measurements using 45° TIR illumination (as shown in Figure 2) and red shifts with increasing PE thickness. Dark-field (DF)-illuminated single NPs (blue squares, five at each layer) exhibit a uniform blue shift (LSP scattering), and 45° incidence TIR evanescent field-illuminated single NP–film scatterers (green circles, five at each layer) exhibit a resonance that tracks the LSP trend from a 0 to ∼10 nm spacer distance and then the SPP resonance (SPR, which exists at this illumination angle) for distances >10 nm. The single NP scatterers include standard deviation bars to indicate NP-to-NP spectral variation. The dashed line and additional data point for the NP–film scatterers at 0 nm indicates a second peak existing in the spectrum at that spacer distance.