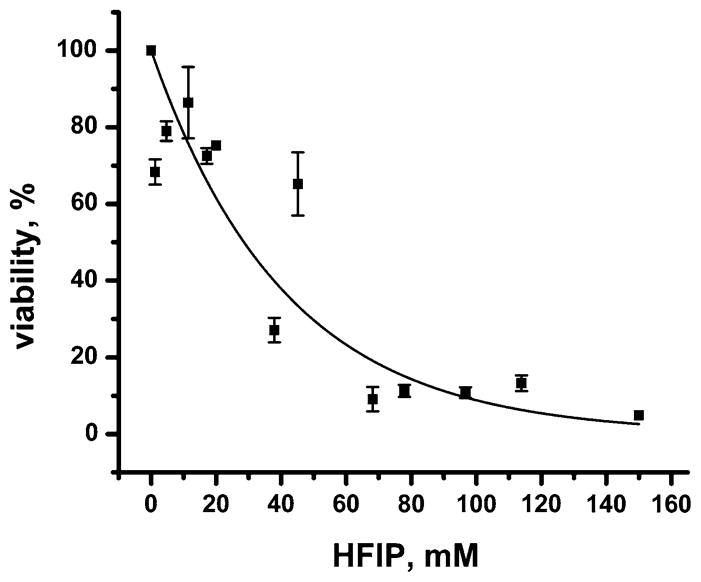
Fig. 3.
Viability of human SH-SY5Y neuroblastoma cells as a function of overnight exposure to various increasing concentrations of HFIP. Data are represented relative to control cells that were treated the same way but without HFIP (corresponding to 100% viability). The solid curve represents a best fit to a first order exponential decay function of the form: Viability (%) = 100% × e−([HFIP] in mM/(41.2 ± 1.2) mM), N = 13, R2 = 0.91

