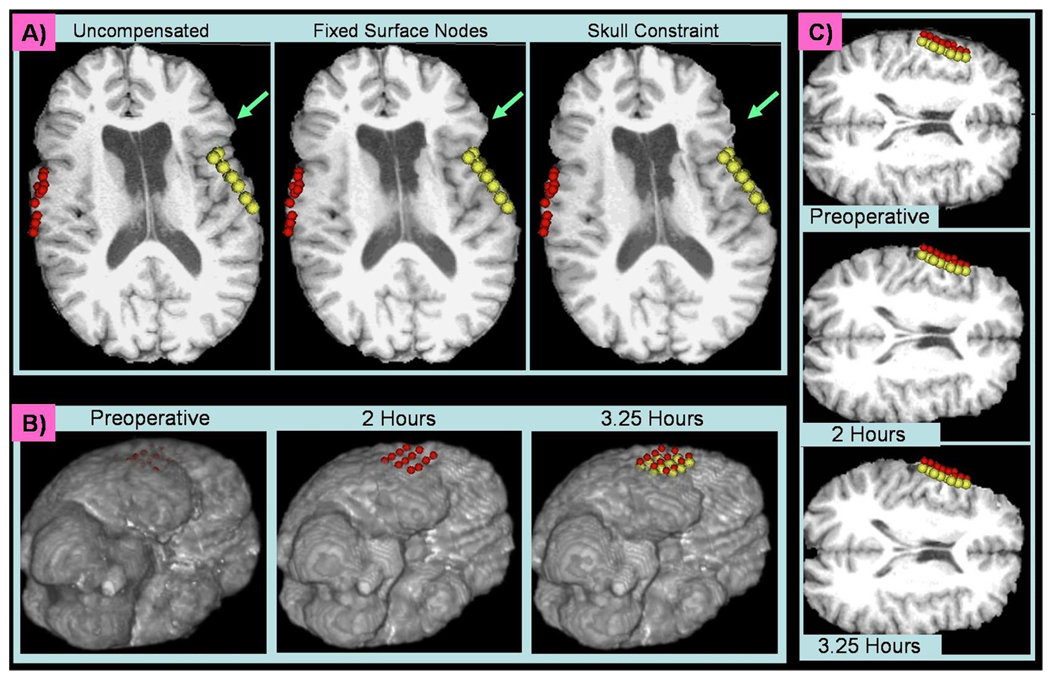
Fig. 3.
A) A slice of the preoperative MRI (left) which has either been deformed using fixed surface nodes (middle) or a skull constraint (right). The red and yellow spheres indicate the surface points acquired during surgery. The aqua arrows are located in the same location on each image. B) One slice of the preoperative (right) and predicted intraoperative initial (middle) and final (left) MR image. As the surface sinks toward the midline over time, the deformation is propagated through the hemisphere and the ventricle begins to collapse. The red spheres were acquired by the neurosurgeon two hours into surgery and the yellow spheres were acquired 75 minutes later. C) Volume Renderings of the Preoperative (left) and Predicted (middle and right) MR Images. The same red and yellow spheres from (B) are plotted here relative to the volume renderings of the deforming brain.

