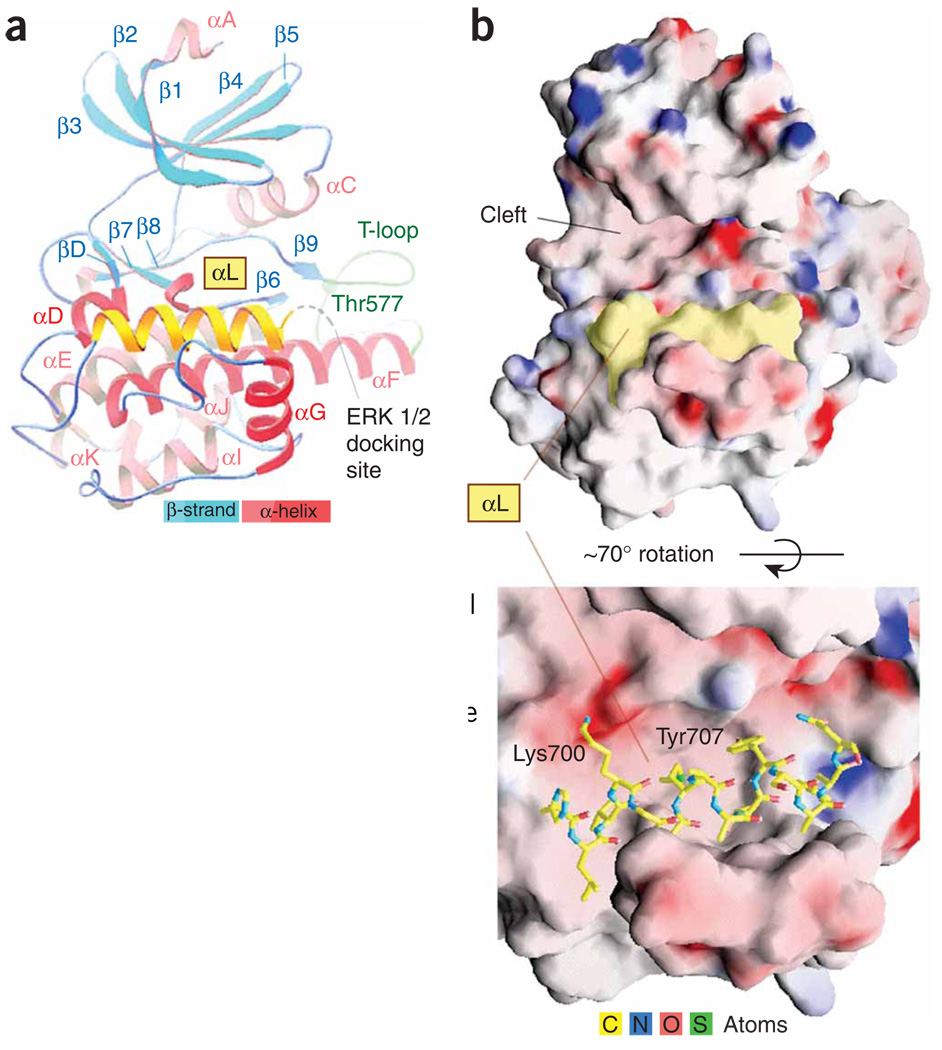
Figure 1.
Crystal structure of the CTD of RSK2. The autoinhibitory C-terminal αL-helix is shown in yellow. (a) The folding diagram. Disordered residues 715–740 are indicated in gray. (b) The ‘cradle’ position of the αL-helix on the potential surface (positive in blue, negative in red). See Supplementary Methods and Supplementary Table 1 online for details of the structure determination and crystallographic statistics, respectively. The sequence alignment is shown in Supplementary Figure 4 online.

