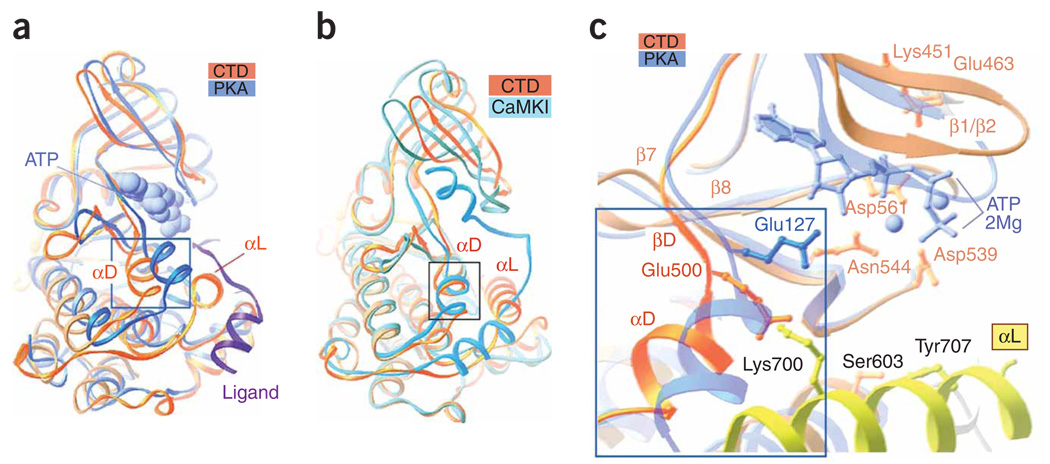
Figure 2.
Distinctive features of the RSK2 CTD. (a) The CTD superimposed on active PKA (chain A from PDB 1CDK) illustrates the different positions of the αD-helix. Boxed region corresponds to boxed region in c. The ligand (inhibitory peptide, purple ribbon) and an ATP analog (AMP-PNP; blue van der Waals surface representation) bound to PKA are included. (b) The CTD RSK2 superimposed on the autoinhibited Ca2+/calmodulin-dependent protein kinase I (PDB 1A06). (c) A comparison of the active sites of CTD and PKA. Selected RSK2 CTD residues are shown. Only residue Glu127 (analogous to Glu500 in the CTD structure), which differs in the two structures, is shown for PKA. The ATP analog and Mg2+ ions (balls) are shown in blue.

