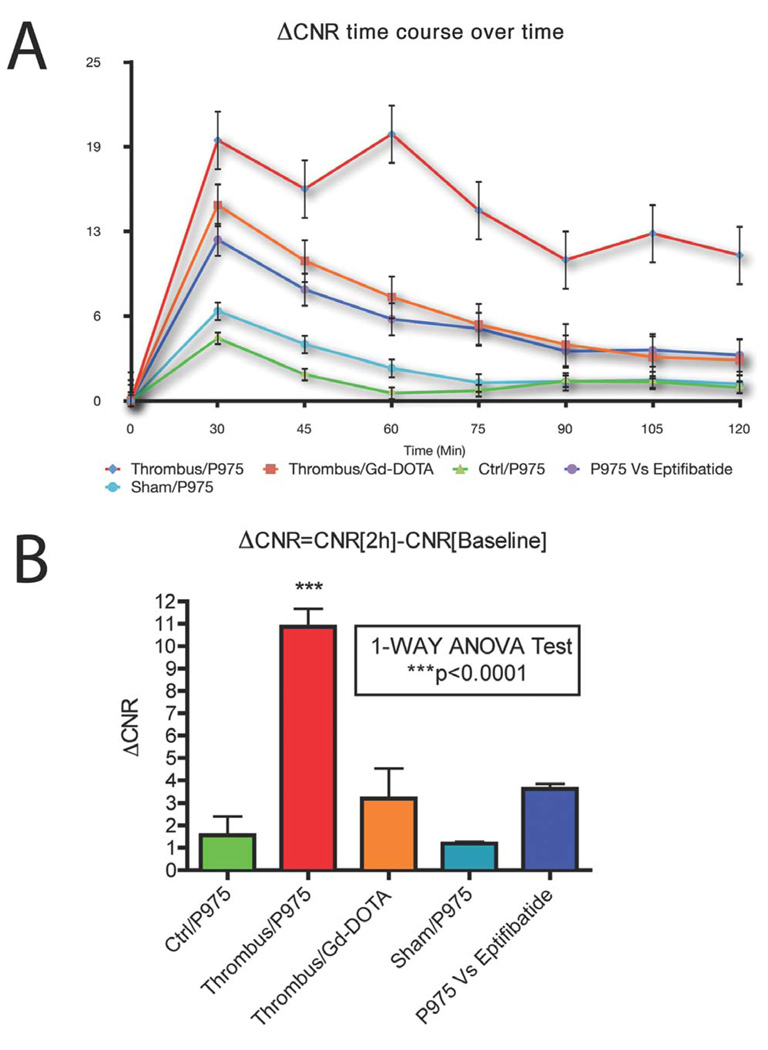
FIGURE 5.
Quantification of signal increases in the carotid artery lumens. (A) ΔCNRs were calculated at each imaging time point and plotted (0 represents the baseline scan). After Gd-DOTA injection, an initial signal increase occurred at 30 minutes post-injection (red line) possibly due to contrast agent molecules being transiently trapped within the mesh of the thrombus. Eventually, the values returned close to baseline over time. In contrast, P975 injection caused a signal increase that was still significantly higher compared to Gd-DOTA at 120 minutes post-injection (dark blue line). Animals injected with Eptifibatide prior to P975 (purple line) exhibited a similar behavior compared to animals injected with Gd-DOTA. The control groups (turquoise blue and green lines) did not show any enhancement. (B) At 2 hours post injection P975 exhibited a significant increase in ΔCNRs compared to the rest of the groups.

