
Figure 2.
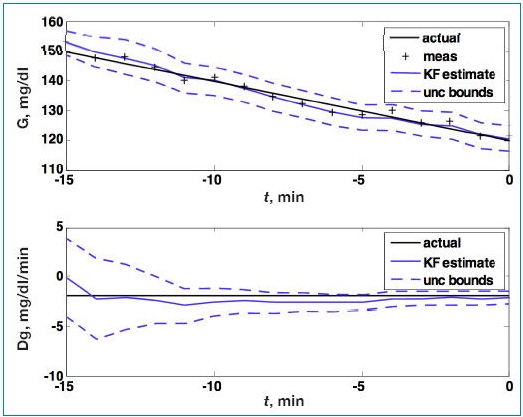
Glucose (G; top) and rate of change of glucose (Dg; bottom). Actual (black), Kalman filter (KF) estimate (blue), and uncertainty (unc) bounds (- - -). The Kalman filter was initialized at t = −15 minutes, with uncertainty in the glucose and rate-of-change states. The estimated error variance improves with measurement (meas) updates. Q = 0.01, R = 4.