
Figure 3.
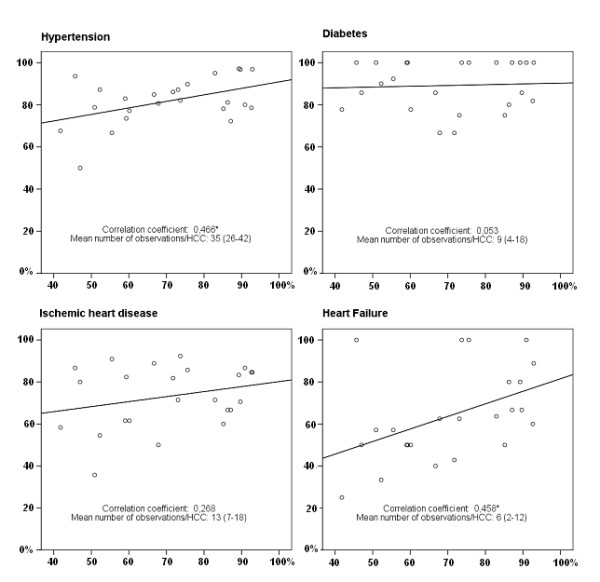
Correlations between coded visits and patients with correct registration for the different diagnoses. Correlation between frequencies of ICD coded visits during 2002-2003 and proportion of patients with correct registration for different diagnoses for each of the 24 health care centres in Skaraborg. * Significant at < 0.05 level. On the X axis: Proportion of coded visits. On the Y axis: Proportion of patients with correct registration.