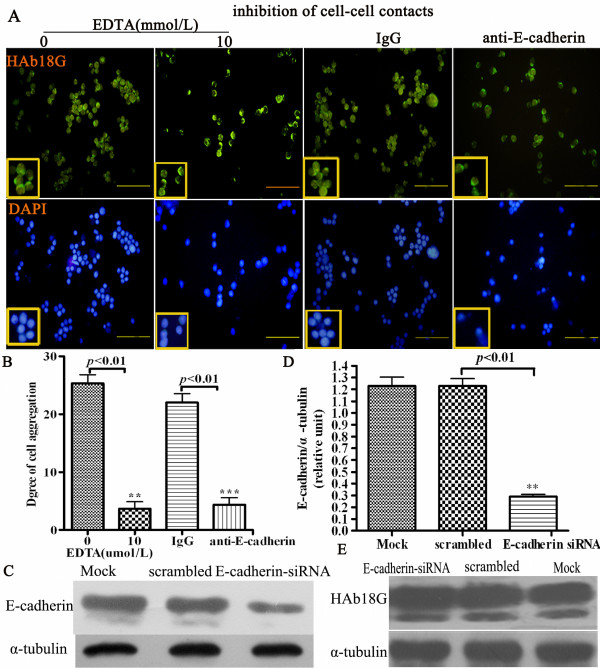
Figure 5.
Effect of E-cadherin blocking or knockdown and EDTA on the cell-cell contact formation and HAb18G/CD147. A. The effect of EDTA and anti-E-cadherin treatment on HAb18G/CD147 expression and cell-cell contacts formation of HEK293ar cells in suspension (n = 4-10). Magnification: ×400. B. The quantification of effect of EDTA and anti-E-cadherin treatment on the cell aggregation (n = 4-10). The degree of cell aggregation was scored as described in Methods. The cells were counted in 4-10 independent sections (at least 300 nuclei/section). ** p < 0.01, EDTA(0) versus EDTA(10); ***p = 0.008< 0.01, IgG versus anti E-cadherin. C. Western blotting to reveal E-cadherin expression in HEK293ar cells in E-cadherin RNA interference (n = 4-6). D. Comparison of the gray scale ratio of E-cadherin/α-tubulin in E-cadherin RNA interference (n = 4-6). ** p < 0.01, siRNA versus scrambled. E. Western blotting of HAb18G/CD147 when E-cadherin was knocked down by E-cadherin siRNA (n = 4-6). p = 0.4775, si RNA versus scrambled. Each value represents the mean ± SD of triplicate determinations. Results are the representative of three similar experiments.

