
Figure 1.
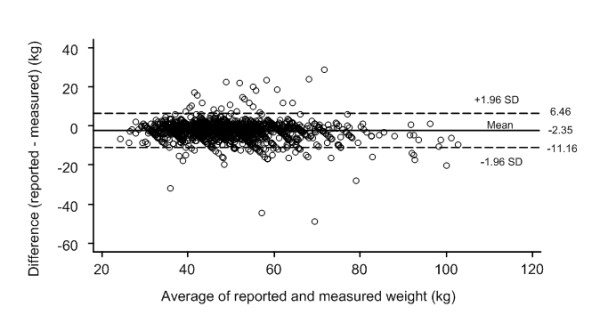
Bland Altman plot [39] of the difference versus the average of reported and measured weights. Broken lines present 95% limits of agreement, where upper LOA is +1.96 SD and lower LOA is -1.96 SD from mean difference (solid line) of methods.
Official websites use .gov
A
.gov website belongs to an official
government organization in the United States.
Secure .gov websites use HTTPS
A lock (
) or https:// means you've safely
connected to the .gov website. Share sensitive
information only on official, secure websites.
Bland Altman plot [39] of the difference versus the average of reported and measured weights. Broken lines present 95% limits of agreement, where upper LOA is +1.96 SD and lower LOA is -1.96 SD from mean difference (solid line) of methods.