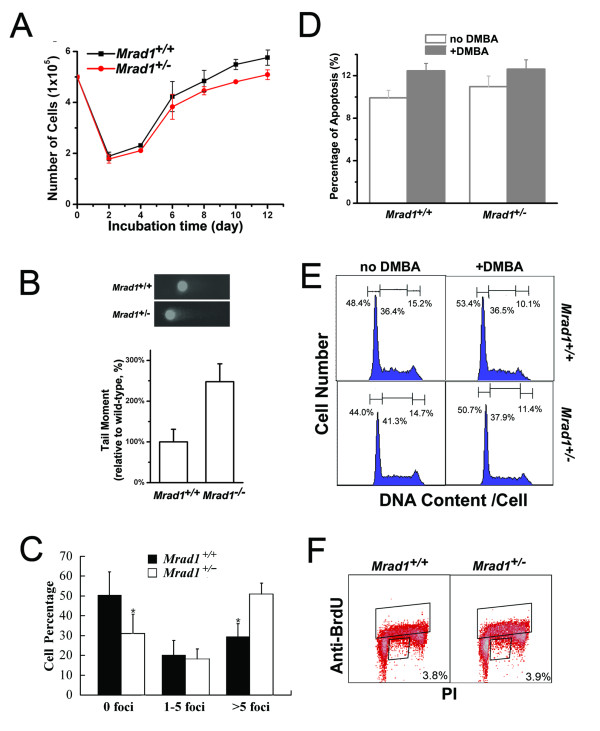
Figure 4.
Proliferation, spontaneous DNA DSBs, apoptosis and cell cycle distribution of Mrad1+/+ and Mrad1+/- keratinocytes. A, Proliferation of skin keratinocytes. The average results were derived from three independent experiments. B, Spontaneous DNA double strand breaks detected with comet assay. The mean values were derived from three independent experiments, and each was the average of assays on 50 cells. C, Spontaneous DNA double strand breaks detected with γ-H2AX labeling. Assessments were made by counting foci in at least 100 cells for every sample, and the result shown is the mean of triplicate samples for each genotype. Statistical analyses: n = 3, P = 0.007 for 0 foci, P = 0.42 for 1-5 foci and P = 0.0009 for more 5 foci, D. Quantitative comparison of apoptosis between Mrad1+/+ and Mrad1+/- keratinocytes mock-treated and treated with DMBA for 24 h. The apoptotic levels were analyzed using Annexin V labeling. E, Comparison of cell cycle distribution of Mrad1+/+ and Mrad1+/- keratinocytes mock-treated and treated with DMBA. The numbers above each phase indicate the percentage of cells in that phase among the whole cell population. Mrad1+/- cells in G1 phase were not more than Mrad1+/+ cells in G1 phase. DMBA-TPA treatment slightly arrested cells in G1 phase. F, The cell cycle distributions of Mrad1+/+ and Mrad1+/- keratinocytes monitored with BrdUrd uptake. The cells were stained with both PI and anti-BrdUrd. The top box indicates BrdUrd-positive cells, and the number in the bottom right box is the percentage of BrdUrd-negative cells with late S phase DNA content.

