Figure 1.
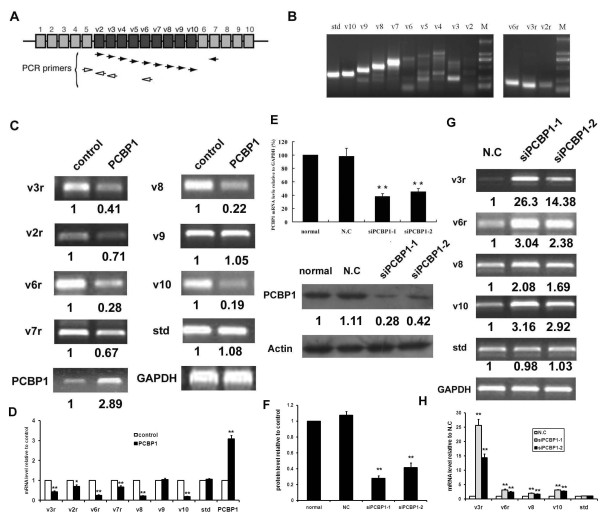
PCBP1 represses CD44 variants splicing. (A) Schematic diagram of the primers. (B) Expression profile of CD44 variants in HepG2 cells. (C) pcDNA3.1(His/Myc)-PCBP1 or control vector were transfected into HepG2 cells for 24 hours and total RNA were extracted for semi-quantitative RT-PCR using the primers indicated in (A). The PCR bands were scanned for densitometry analysis with the value obtained from control cells set as 1. The values were normalized with those of GAPDH. Statistical analysis was performed and the results represented mean ± SD of 3 independent experiments. The statistical difference between the samples was demonstrated as *p ≤ 0.05 and ** p ≤ 0.001 (D). (E) Knockdown of PCBP1. HepG2 cells were transfected with a negative control siRNA (N.C) or PCBP1 specific siRNA oligos (siPCBP1-1 and siPCBP1-2) for 48 hours. The level of PCBP1 was examined by Real-time PCR analysis (upper panel) and Western blotting (bottom panel). Cells with mock transfection were used as control (normal). For Real-time PCR, GAPDH was used as internal control. For Western blotting, the blots were scanned for densitometry analysis with the value obtained from control cells set as 1. The values were normalized with those of Actin. Statistical analysis was performed and the results represented mean ± SD of 3 independent experiments. (F). The levels of CD44 variants were examined by semi-quantitative RT-PCR (G). The PCR bands were scanned for densitometry analysis with the value obtained from N.C cells set as 1 (H).

