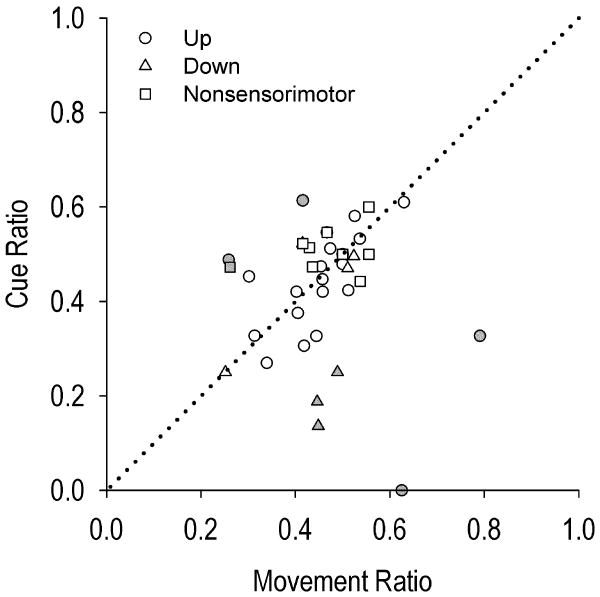
Figure 3.
Scatterplot of movement ratio (x-axis) by cue ratio (y-axis), averaged over late (last four) days of training. Dotted diagonal line represents no difference between the two ratios, i.e., no cue-evoked change in firing. See Figure 4 for gray shaded neurons.

