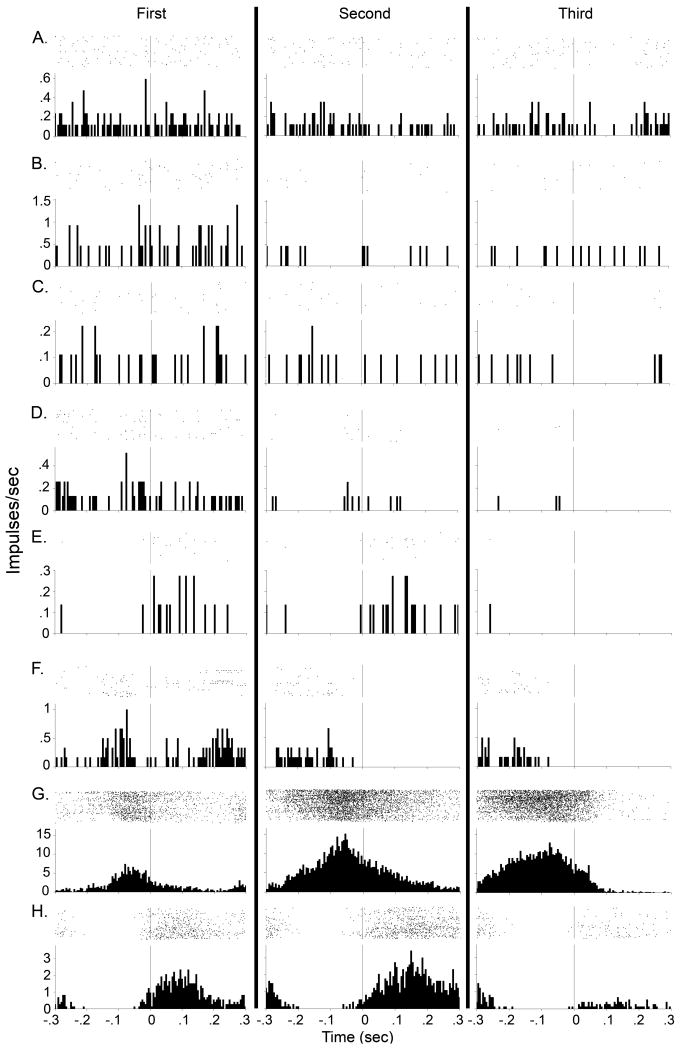
Figure 4.
A representative raster and PETH during one of the last four days of training is presented for each outlier neuron shaded gray in Figure 3 (each row). Each row of the rasters represents one criterion head movement. Each dot of the rasters represents one action potential. Each PETH represents the average firing rate of the DLS neuron over all criterion movements (first, second or third movements of the FR3 schedule) in that session. Vertical line at time zero in raster and PETH represents detection of criterion head movement. Column 1 represents firing rates during the first unsignaled criterion head movement. Column 2 represents firing rates during the second unsignaled criterion head movement. Column 3 represents firing rates during the third (signaled) criterion head movement, with the conditioned stimulus cue presented at time zero. Columns are separated by solid black lines. PETH bin size is 5 ms. For each neuron, first, second, and third column contains the same number of trials in each PETH, which were 1683 (A), 433 (B), 1791 (C), 1547 (D), 1206 (E), 1459 (F), 1459 (G), and 1299 (H). Nonsomatomotor neuron is A; upward-associated neurons are B, D, F G; downward-associated neurons are C, E, H.

