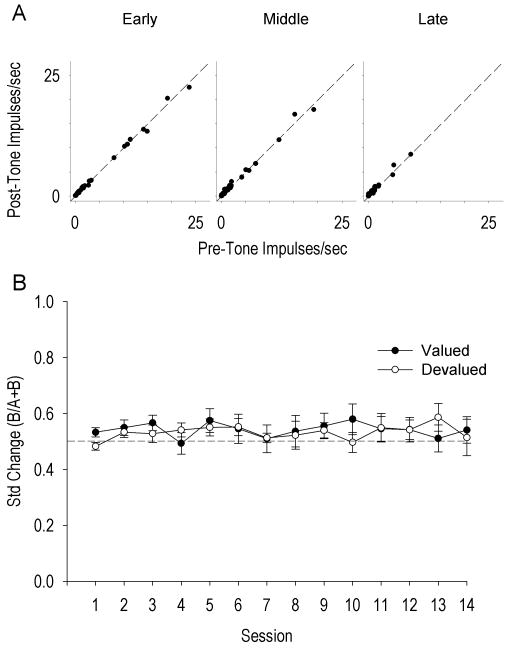
Figure 6.
A. Scatterplot of averaged pre-tone (x-axis) by post-tone (y-axis) firing rates averaged over early (days 1, 3, 4, and 5), middle (days 6, 7, 8, and 9), and late (days 10, 11, 12, 14) training days for all lick neurons. Dotted black lines represent no change in firing between pre and post tone firing rates, not a regression line. B. Average (+SEM) standardized change of DLS lick neurons for devalued and valued groups across training days. Dotted line at 0.5 indicates no change in firing rate between pre-tone and post-tone conditions.

