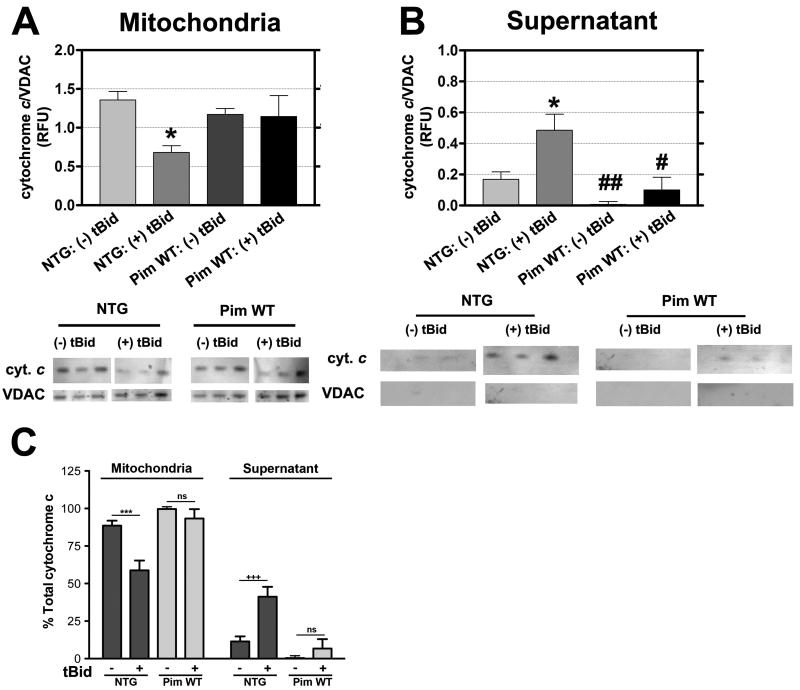
Figure 7. Pim-1 overexpression decreases cytochrome c release from mitochondria.
Preparations of NTG versus Pim WT under normal conditions (- tBid) or challenged with tBid (+ tBid) and subsequently separated into mitochondrial pellet (A) or supernatant (B) fractions for immunoblot analysis to quantitate cytochrome c levels. Corresponding quantitative graph is normalized to VDAC as a loading control. Results are represented as mean ± SEM. N = 5 hearts. Two-way ANOVA: *P<0.05 for untreated NTG vs. tBid treated NTG in mitochondrial and supernatant fraction, #P<0.01 for tBid treated NTG vs. tBid treated Pim WT in supernatant fraction, ##P<0.001 for tBid treated NTG vs. untreated Pim WT in supernatant fraction. (C) Corresponding percentage of total cytochrome c in mitochondrial and supernatant fractions of untreated and tBid treated isolated NTG and Pim WT mitochondria. Two-way ANOVA: ***P<0.001 for untreated NTG vs. tBid treated NTG in mitochondrial fraction, +++P<0.001 for untreated NTG vs. tBid treated in supernatant fraction, ns = not significant for untreated Pim WT vs. tBid treated Pim WT in mitochondrial and supernatant fraction.

