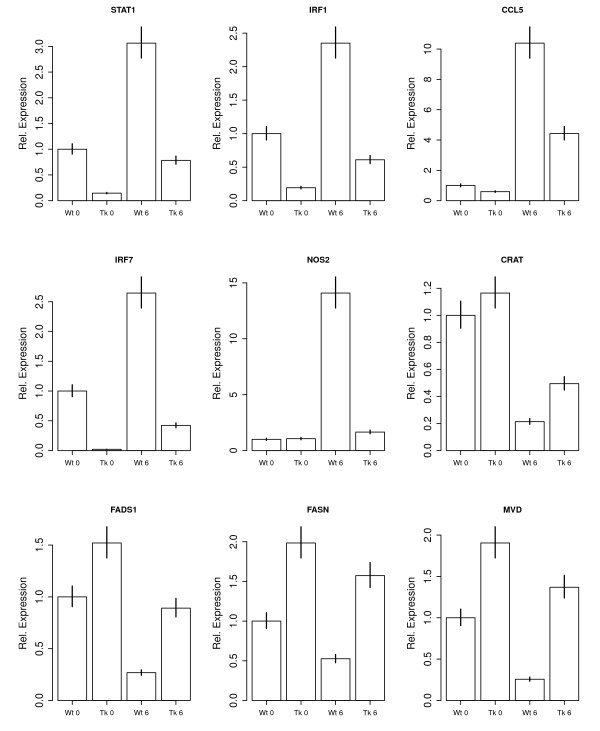
Figure 2.
Effects of Tyk2 and LPS on relative expression levels of immune genes and lipid genes. Representative examples of the effects of genotype (Wt vs.Tyk2-/- (Tk)) at the basal level (0) or after six hours of LPS treatment (6). Five genes (STAT1, IRF1, CCL5, IRF7, NOS2) are immunity annotated and IFN-responsive genes; four genes (CRAT, FADS1, FASN, MVD) are annotated for lipid metabolism. Expression levels, as determined by microarray fluorescence intensities, are shown relative to the mean basal level in the Wt. Error bars represent standard errors. All genes were validated with RT-qPCR (see Materials and Methods).

