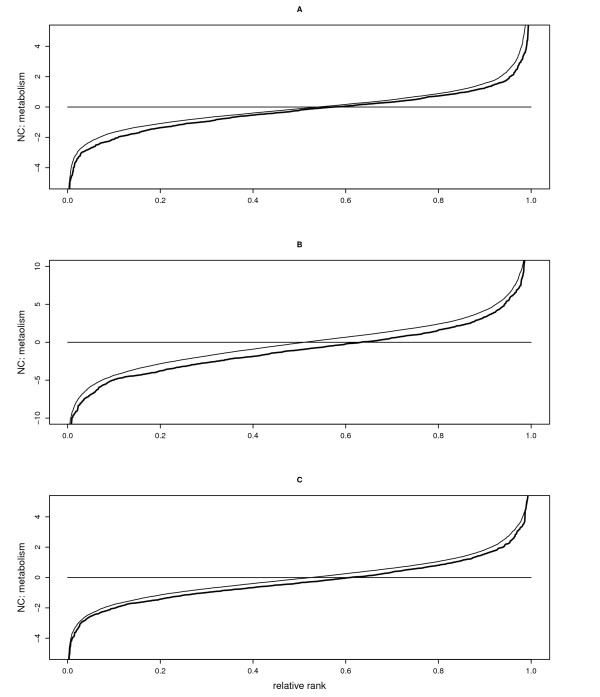
Figure 3.
Effects of Tyk2 and LPS on metabolic gene expression. Effects of (A) Tyk2 genotype (Wt minus Tyk2-/-), (B) LPS treatment (6 hours of LPS minus control), and (C) genotype by treatment interaction (difference in LPS induction between Wt and Tyk2-/-) on expression levels of genes annotated for metabolism, plotted as NCs (y-axis) against relative ranks (absolute rank divided by the number of genes; x-axis). Thick solid lines represent NCs; thin solid lines the values of all genes (see Figure 1) in order to highlight effects on metabolic genes relative to all genes analyzed.

