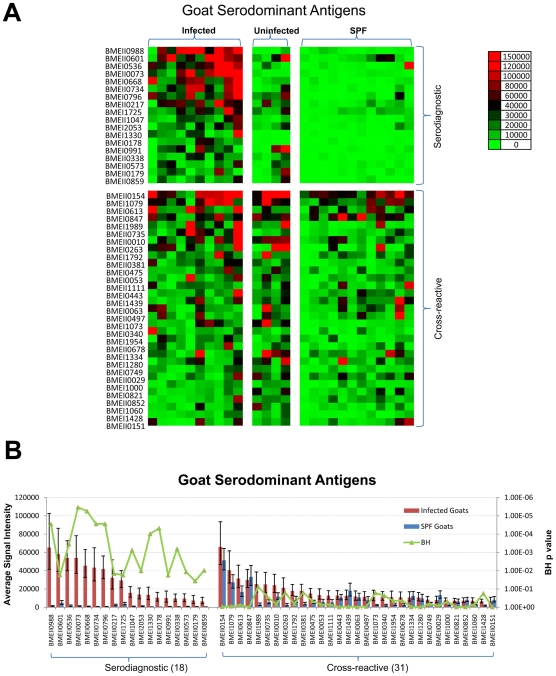
Figure 2. Probing a collection of B. melitensis infected, uninfected, and SPF control goat sera and discovery of goat serodiagnostic antigens.
Arrays containing 1406 B. melitensis proteins were probed with goat sera organized into 3 groups as described in the text. (A). Heatmap showing normalized intensity with red strongest, bright green weakest and black in between. The antigens are in rows and are grouped to serodiagnostic and cross-reactive antigens. The goat samples are in columns and sorted left to right by increasing average intensity to serodiagnostic antigens. (B) The mean sera reactivity of the 1406 antigens was compared between the Infected and SPF Naive groups. Antigens with Benjamini Hochberg corrected p-value less than 0.05 are organized to the left and cross-reactive antigens to the right. The 18 most reactive serodiagnostic and 31 of the most reactive cross-reactive antigens are shown.

