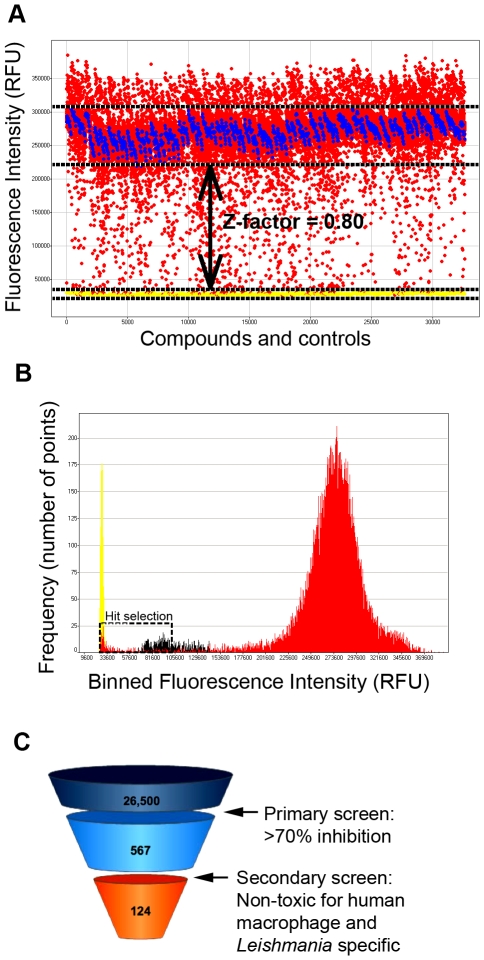
Figure 2. Antileishmanial HTS with 26,500 compounds.
A) Distribution plot of the 26,500 compounds (red dots), 1% DMSO (blue dots), EC100 (yellow dots) and Z-factor = 0.80. B) Frequency distribution of the 26,500 compounds based on binned RFUs, highlighting active compound selection with a black dashed box. Data for reference compound EC100 in yellow, for reference compound EC50 in black and for the 26,500 compounds in red. C) A funnel representing selection of antileishmanial activity from 26,500 compounds to 124 hit compounds after primary screening (antileishmanial activity against promastigotes), secondary screening (toxicity exclusion) and no redundancy against Mycobacterium tuberculosis or HIV screenings done in-house.

