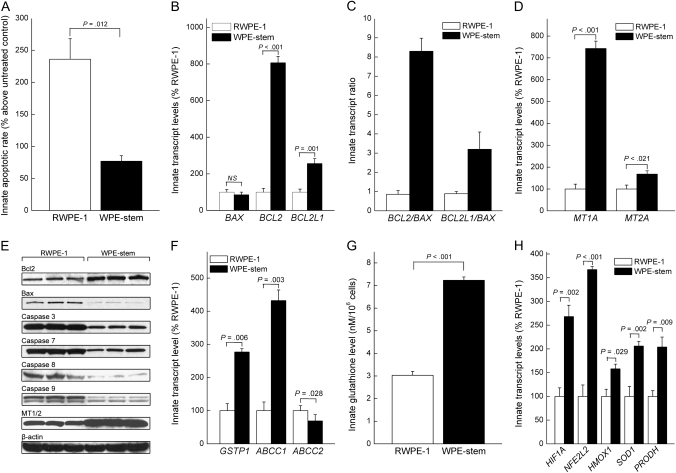
Figure 2.
Levels of arsenite-induced apoptosis and innate expression levels of apoptosis- and arsenite stress–related factors. A) Apoptotic rates in RWPE-1 and WPE-stem cells treated with 30 μM arsenite for 24 hours. Data are presented as the mean percent increase in apoptosis over the respective untreated control cells (n = 3). B) Mean transcript expression levels of various general apoptosis-related factors (n = 3). NS = not statistically significant. C) Mean BCL2/BAX and BCL2L1/BAX transcript ratios (n = 3). D) Mean MT1A and MT2A transcript levels in WPE-stem and RWPE-1 cells (n = 3). E) Western blot analyses comparing various apoptosis-related factors in RWPE-1 (left three lanes) and WPE-stem cells (right three lanes). Each lane (25 μg protein per lane) corresponds to an independently prepared protein sample (n = 3). β-Actin was used as the control for equal protein loading. F) Mean transcript expression levels of arsenic efflux–related factors in WPE-stem and RWPE-1 cells (n = 3). G) Mean innate glutathione levels in RWPE-1 and WPE-stem cells (n = 3). H) Mean transcript expression of various arsenic-specific and metabolism-related stress factors in RWPE-1 and WPE-stem cells (n = 3). For comparisons of transcript expression levels, data are presented as the percent expression vs RWPE-1 (control) cells. Error bars represent 95% confidence intervals. All P values are two-sided (Student t test).

