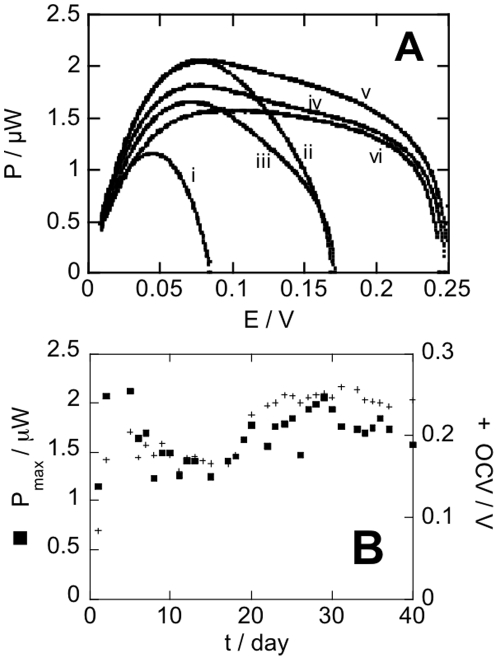
Figure 2. In vitro performances of a Quinone-Ubiquinone GBFC.
The GBFC is immersed in 50 mL HEPES buffer (2.5 10−2 mol L−1; pH 7.2) containing 5.5 10−3 mol L−1 glucose and 0.15 mol L−1 NaCl. (A) Power-voltage profile; i) first day, ii) second day, iii) sixth day, iv) twenty fourth day, v) twenty ninth day vi) fortieth day. (B) Maximum power (▪) and OCV (+) as a function of time.

