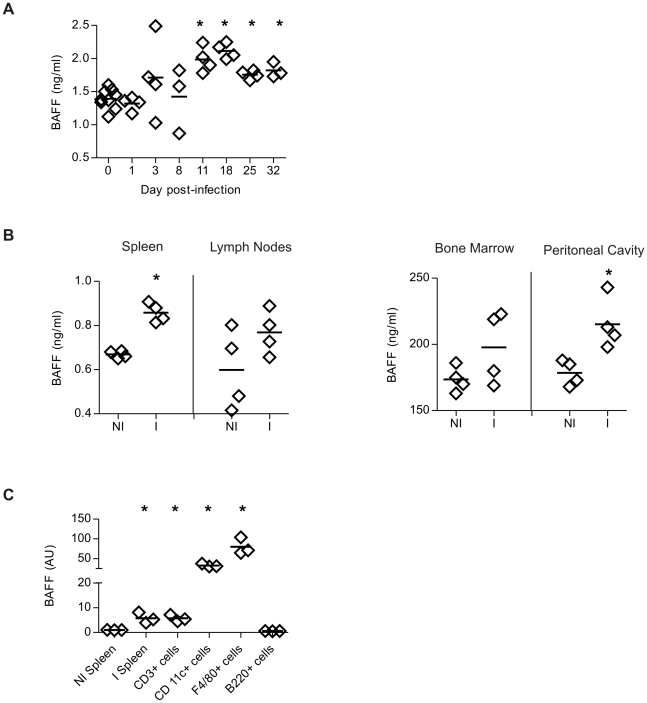
Figure 1. BAFF production in T. cruzi infected mice.
BAFF concentration (ng/ml) was determined by ELISA in: A, Sera from non-infected (day 0) or T. cruzi infected mice obtained at different times of infection, B, culture supernatant of cells from spleen, bone marrow, lymph nodes and peritoneal cavity from non-infected (NI) or T. cruzi infected (I) mice obtained at 15 days p.i. C, Splenic CD3+, CD11c+, F4/80+ and B220+ cells from T. cruzi infected mice were purified by cell sorting. mRNAs were obtained from these populations from total splenic cells from I mice. Spleen cells from NI and I mice were used as control. BAFF mRNA levels were quantified by Real Time PCR. The amounts of transcripts were normalized to HPRT transcripts and were expressed relative to the amount in splenic cells from NI mice. Diamonds represent the value obtained from each mouse. The lines represent the media value in each analyzed group. *, p≤0.05. Results are representative for two individual experiments.

