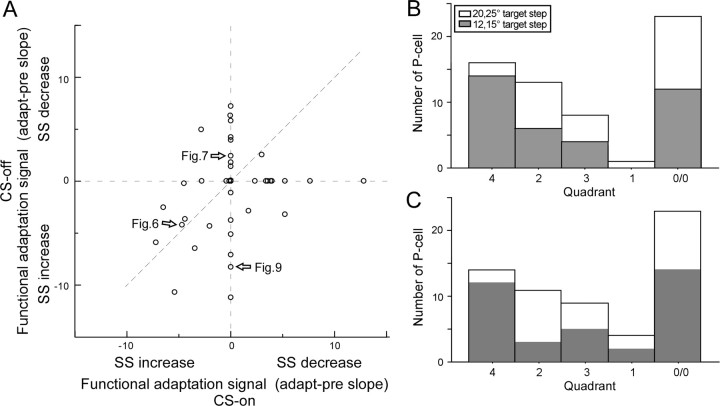
Figure 10.
Comparison of the functional adaptation signals in all 61 P-cells. A, The functional adaptation signal (mean difference of the slopes of the average spike rate vs amplitude relationship for adapted minus preadaptation saccades) in the CS-off and CS-on directions. Because adaptation caused a decrease in saccade amplitude, negative slopes indicate an increase in SS activity and positive slopes indicate a decrease. The arrows identify P-cells appearing in previous figures. B, Number of P-cells whose functional adaptation signals in the CS-on and -off directions (A) place them in five different functional categories. Categories include P-cells with data that lie in the fourth quadrant and on its axes (left histogram bar), data that lie in the second quadrant and on its axes (second bar), data from the third quadrant (third bar), data from the first quadrant (fourth bar), and data at the origin (fifth bar). The gray bars indicate that the primary saccade was to 12 or 15° target steps; the white bars indicate data for primary saccades to 20 or 25° target steps. C, Units categorized as in B but analyzed on the whole data set without resampling (see text).

