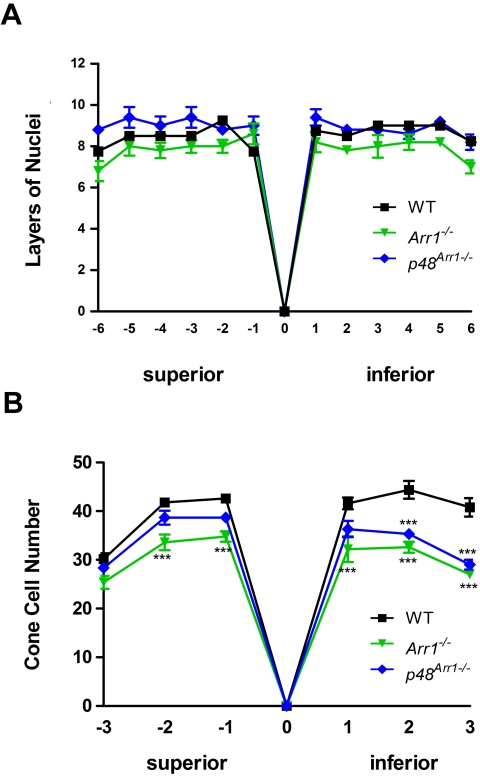
Figure 3.
Quantitative spider plot analysis of mouse retinas at P60 from control (WT), Arr1−/−, or p48Arr1−/−. (A) The total number of layers of nuclei in the ONL of hematoxylin and eosin–stained retinal sections through the optic nerve (0) was measured at 12 locations around the retina, six each in the superior and inferior hemispheres. At least four mice of each genotype were counted. Two-way ANOVA with Bonferroni posttests compared Arr1−/− or +p48Arr1−/− transgenic mice with WT at each segment measured. (B) The number of cones in the photoreceptor layer of mCAR-LUMIj immunologically stained retinal sections through the optic nerve (0) was counted in six 290-μm segments, three each in the superior and inferior hemispheres 100 μm from the optic nerve. At least four retinas of each genotype were counted. Two-way ANOVA with Bonferroni posttests compared KO mice with WT in all segments (***P < 0.001).

