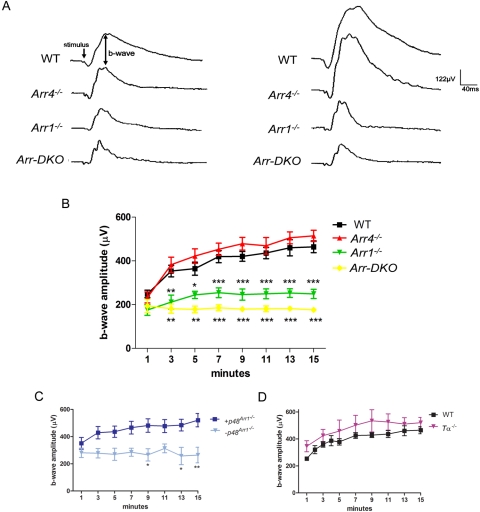
Figure 5.
ERG analysis of P35 to P60 control (WT), visual arrestin knockouts (Arr1−/−, Arr4−/−, Arr-DKO), p48Arr−/−, and Tα−/− mice. A bifurcated glass fiber optic delivered both maximum intensity (2.01 log cd · s/m2) 10-μs bright flashes and a 200 cd/m2 steady background white light to a level 1 cm from the cornea. (A) Representative responses to bright flashes (stimulus) of WT and visual arrestin KO mice at 1 minute (left waveform data) and after 15 minutes of continuous background illumination (right waveform data). Average photopic b-wave amplitudes (μV) recorded every 2 minutes during 15 minutes of light adaptation of the (B) WT and visual arrestin knockout mice, (C) transgenic p48 mice bred onto an Arr1 null background (Arr1−/−) with confirmed Arr1 (+p48Arr1−/−) or negative littermate controls (−p48Arr1−/−), and (D) rod alpha transducin (Tα−/−) mice. Two-way ANOVA with Bonferroni posttests used for statistical comparisons with controls (***P < 0.001; **P < 0.01; *P < 0.05).

