
Figure 1.
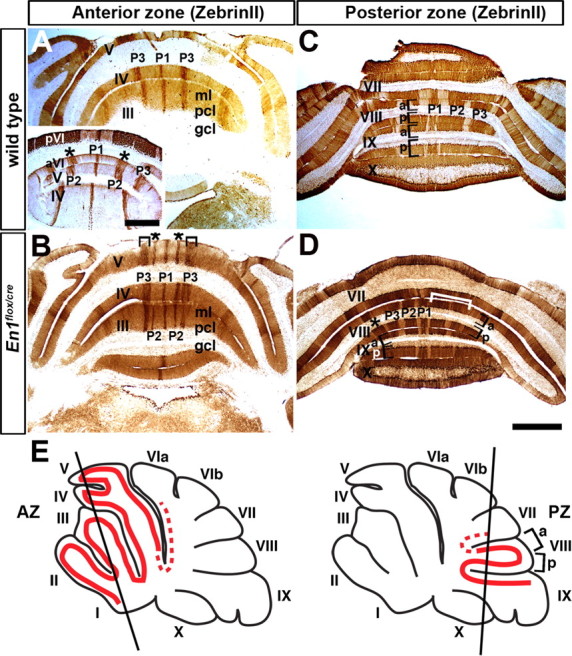
Molecular coding is altered in En1flox/cre mutant mice that have normal foliation. A, ZebrinII expression reveals three distinct ML stripes in the AZ of wild-type mice as seen on coronal cut tissue sections. Only the P1+ and P3+ stripes are seen in lobules I–IV. In lobule V, P2+ is also seen (inset). B, In En1flox/cre mutants, P2+ ZebrinII stripes extend forward past the primary fissure into lobule III. The P3+ stripes are thicker in En1flox/cre mutants compared with wild-type mice. The asterisks in A and B indicate the position of P2+, and the inverted brackets in B highlight the increased thickness of P3+ in En1flox/cre mutants. C, In the vermis of lobule VIII (PZ), two stripes flank the midline stripe and each one has a different width. D, In En1flox/cre mutants, the stripes in aVIII are poorly defined and often fused (white bracket) on one side of the Cb. In pVIII, three stripes flank the midline stripe instead of only two as in wild-type mice. E, The schematics illustrate the locations of ZebrinII stripes (solid red lines) in the AZ and PZ, and the slanted black lines indicate the levels of where the tissue sections were taken. The dotted red lines indicate the “transition zones” in which the pattern of ZebrinII stripes can vary from animal to animal (also applies to Figs. 5 and 7). In all figures, the lobules are indicated by Roman numerals. a, Anterior; p, posterior; ml, molecular layer; pcl, Purkinje cell layer; gcl, granule cell layer (in this and all figures). Scale bars (in A), 500 μm; (in D), 1 mm (applies to all other panels).