
Figure 3.
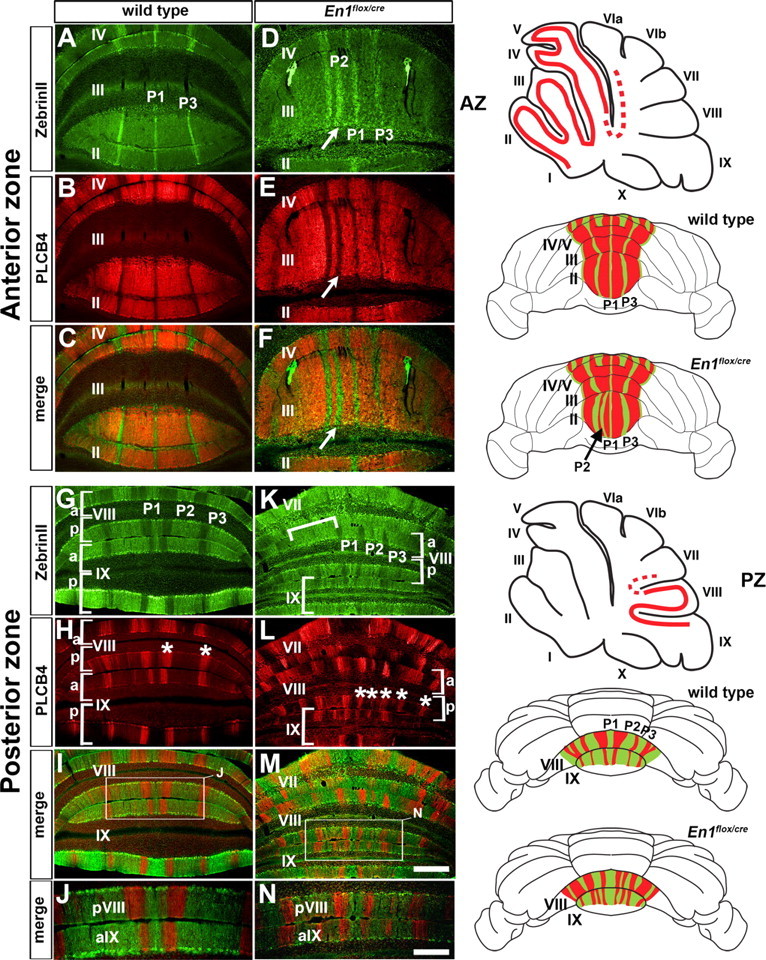
ZebrinII and Plcβ4 molecular coding are altered in unison in En1flox/cre mutant mice. A–C, G–J, ZebrinII and Plcβ4 are expressed in complementary ML stripes in the anterior (A–C) and posterior (G–J) lobules of wild-type mice. The asterisks in H indicate two Plcβ4 immunoreactive stripes in pVIII. D–F, K–N, ZebrinII and Plcβ4 expression patterns are disrupted in the anterior (D–F) and posterior (K–N) lobules of En1flox/cre mutants, but their complementary relationship is preserved. The arrows in D–F point to the extended P2+ stripe in lobule III of En1flox/cre mutants. The inverted white bracket (K) indicates a region of uniform ZebrinII expression, and the asterisks (L) indicate additional Plcβ4 positive stripes in En1flox/cre mutants (compare with the number of stripes in wild type as indicated by asterisks in H). The regions outlined by the white boxes in I and M are shown at higher power in J and N. The sagittal schematics illustrate the locations of ZebrinII ML stripes in the AZ and PZ (dotted red lines indicate “transition zones”), and the whole-mount schematics illustrate the complementary patterns of ZebrinII and Plcβ4 expression in the AZ and PZ of wild-type and En1flox/cre mice. Note that for clarity, we have drawn clear boundaries between each stripe in the PZ of this example of an En1flox/cre mutant (see Results for details). Scale bars (in M), 500 μm (applies to A–I and K–M); (in N), 250 μm (also applies to J).